Intro
Optimum recently announced that mump2p is delivering 150ms average block propagation on Ethereum Hoodi testnet - 6x faster than Gossipsub's ~1 second baseline. This significant performance gain directly benefits validators with more time to attest, higher inclusion rates, and better performance during congestion, while improving overall chain efficiency and user experience. So how is this actually measured? Where do these numbers come from? This post walks through the technical implementation - the measurement methodology, the metrics architecture, and the validation approach that produces these results.
TL;DR
- Dual-path measurement: Every block propagates through both mump2p and Gossipsub simultaneously, ensuring fair comparison
- 30 globally distributed gateways record timestamps for both protocols, eliminating cherry-picking
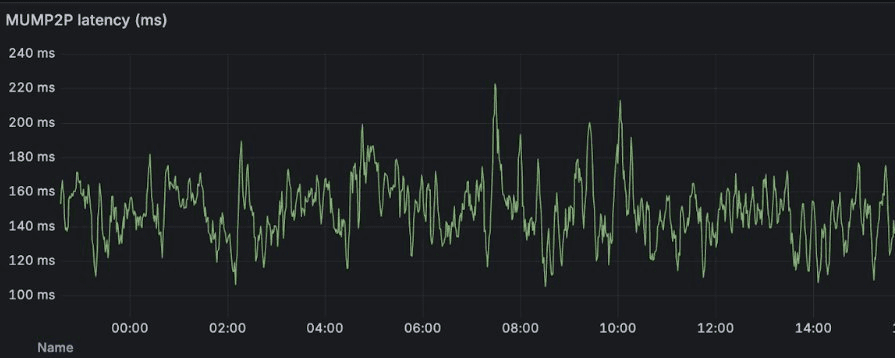
- 150ms average latency vs ~1 second baseline, with spikes to 200-250ms during cross-continental propagation
- Conservative 6x claim uses ethPandaOps' fastest Gossipsub numbers as baseline - real-world performance gap is larger
The Dual-Path Problem
The hardest part wasn't making mump2p fast - it was proving it fairly. How do you demonstrate a speedup without cherry-picking favorable conditions or comparing apples to oranges? The answer: measure both protocols simultaneously on identical traffic.
The Ethereum Hoodi testnet deployment consists of 30 globally distributed nodes running the Optimum Gateway. Each gateway operates as a transparent acceleration layer between a validator's consensus layer client (Lighthouse, Prysm, or Teku) and Ethereum's network. When a consensus client receives or produces a block, it passes through the gateway, which then performs two operations simultaneously: it forwards the block through the mump2p network to all other gateways, and it also publishes to Ethereum's standard gossipsub protocol so the rest of the network receives it.
This eliminates the classic measurement trap. If gossipsub sees 2 seconds on slot 1000 and mump2p sees 150ms on slot 1001, that proves nothing - network conditions differ. But when the same block propagates through both paths from the same gateway at the same instant? Same conditions, same block size, same source - only the protocol varies.
Measurement Methodology: Timestamp-Based Latency Tracking
The core principle: record timestamp of every block on arrival, then calculate the difference between current time and the slot's start time - that gives us propagation latency.
The gateway tracks this separately for each source. When a block arrives via Ethereum's native gossipsub, it records an libp2p timestamp. When the same block arrives via the Optimum network, it records a mump2p timestamp. This dual tracking enables the side-by-side comparison. The implementation captures several timing data points for each block:
- Slot Time: The expected start time of the slot (deterministic)
- libp2p Received: When libp2p gossipsub delivered the block
- mump2p Received: When the Optimum network delivered the block
- Gateway ID: Which gateway recorded this measurement
These data points flow into a telemetry system that aggregates measurements across all 30 gateways, enabling network-wide latency analysis.
Measurement Challenges
Building timestamp-based latency tracking across 30 globally distributed nodes revealed problems we didn't anticipate:
- Consensus Client Compatibility: The first deployment revealed an unexpected issue. We developed the integration against Prysm, which worked flawlessly. Then we tested Teku - connection failed. Then Lighthouse - different failure mode. The culprit? Different consensus clients implement Ethereum's mandatory handshake ceremonies with varying strictness. Prysm is more lenient; Teku and Lighthouse validate every byte of the initial handshake protocol. We weren't following the strictest interpretation, so pickier clients rejected our connections. The fix was tedious but straightforward: implement the handshake to satisfy the strictest clients - if they accepted it, Prysm would too.
- 200ms+ Spikes: The graphs show mump2p averaging 150ms, but spikes to 200-250ms appear regularly. The cause? Geography and physics. Our gateways are distributed globally (currently: US, EU, Asia), and when a block originates in Europe and must reach Asia, it traverses continents. Every gateway sees these spikes because cross-continental routing and transient network congestion affect the entire fleet simultaneously.
The Metrics System: Prometheus Histograms
All measurements feed into Prometheus histograms (buckets: 10ms to 40 seconds) that automatically calculate averages, percentiles (p50/p95/p99), and distributions. This provides multiple views: latency consistency across the fleet, time-series evolution, and real-time performance.
The graphs shown in the announcement come directly from these Prometheus time-series, scraped every 5 seconds from all 30 gateways.
Metric Categories: What Gets Measured
The telemetry system captures metrics across several categories to enable debugging and analysis.
Message Flow Counters track throughput at ingress and egress points. The gateway increments counters when messages arrive from consensus clients (libp2p_total_messages) and when forwarded to the Optimum network (optimum_total_messages).
Per-topic Counters identify which gossip topics carry the most traffic. Latency Measurements capture propagation timing at multiple levels. The gateway calculates message propagation latency by comparing send timestamps to arrival time.
Message Size Histograms record the byte size of each message in exponential buckets from 256 bytes to 1.1 MB. Rolling 5-second windows track max, min, average, and median sizes per topic. This helps identify large messages that could indicate issues.
Aggregation Metrics monitor the batching system. The gateway counts how many messages get included in each aggregated batch and tracks the resulting protobuf sizes. This reveals batching efficiency and helps tune the ~25ms aggregation interval.
Peer Connectivity Gauges track current peer counts for both consensus layer connections and Optimum network peers. Separate counters increment on connect and disconnect events, revealing peer churn patterns.
All metrics are exposed via Prometheus endpoints, enabling real-time monitoring and historical analysis through standard dashboarding tools.
Baseline Comparison: Why 6x is Conservative
The ~1 second Gossipsub baseline comes from ethPandaOps' monitoring infrastructure. Specifically, their xatu-mimicry project tracks block arrival latency across globally distributed sentry nodes. This provides an independent, third-party measurement of real-world Ethereum gossipsub performance. The comparison methodology uses ethPandaOps' low-end (fastest) latency numbers.
This conservative approach means the 6x improvement is actually an understatement - during network congestion or when comparing average latency rather than best-case scenarios, the performance gap widens significantly.
Conclusion
The 150ms block propagation is measured from 30 globally distributed gateways. The dual-path architecture ensures fair comparison by routing every block through both protocols simultaneously. AB-testing enables controlled validation on alternating slots. For validators, the 6x speedup translates to more time to attest, higher inclusion rates, and better performance during congestion.
References
- Optimum Gateway Metrics Methodology: https://getoptimum.github.io/optimum-gateway/versions/v0.0.1-rc6/metrics_methodology
- Ethereum Consensus Specifications: https://github.com/ethereum/consensus-specs
- Gossipsub Protocol Specification: https://github.com/libp2p/specs/blob/master/pubsub/gossipsub
- ethPandaOps xatu-mimicry: https://github.com/ethpandaops/xatu